
If you can’t tie risk work to dollars, it’s hard to defend the budget. I’d boil this article down to four numbers a CFO can take to the board: labor saved, cost per assessment, time to remediation, and annual loss reduced.
Here’s the short version: healthcare breach costs are high, manual risk work eats up staff hours, and slow reviews can leave issues open for months. This article shows how I can turn that into a finance case with ROI, payback period, NPV, and ALE, using a simple healthcare example with $477,500 in annual quantified benefit under conservative assumptions.
What the article covers, in plain English:
- Why manual risk work costs so much
- Third-party reviews can take 20 to 60 hours
- Audit prep can take hundreds of staff hours
- High-risk issues may stay open 60 to 180 days
- What AI changes
- Fewer hours per assessment
- Less repeat work in reassessments
- Better tracking of exceptions, owners, and due dates
- What finance should measure
- ROI = (Benefits − Costs) / Costs
- Payback period = Initial investment / Annual net benefit
- ALE = SLE × ARO
- What to show the board
- Cost per assessment
- Review time
- Time to remediation
- Exception rate
- Audit hours
- Framework coverage
A simple example from the article makes the case clear: if a health system lowers assessment labor, trims audit prep, cuts control testing hours, and reduces expected breach frequency, the result can be lower spend and lower risk at the same time.
That’s the core point of the piece: risk operations should be measured like any other finance-backed function - with clear formulas, conservative assumptions, and trend lines the board can track.
The Cost of Manual Risk Work in Healthcare
Where manual work creates direct cost
Manual GRC work creates repeat labor cost that often gets buried across teams. For CFOs, this shows up as recurring operating expense. And the biggest driver is labor.
Take a single third-party security assessments. Between questionnaire distribution, evidence review, follow-up, and documentation, it usually takes 20 to 60 combined hours across risk, security, legal, and procurement. At a fully loaded $75 to $110 per hour, that puts one vendor review at about $3,000 to $4,400 before remediation even starts.
Scale that across business associates, cloud platforms, and device suppliers, and annual labor spend climbs fast. HIPAA compliance alone averages $1.8 million per year for U.S. healthcare organizations, with individual audits running around $45,000 each.[4] Enterprise control testing across NIST CSF or HITRUST frameworks can eat up hundreds to thousands of staff hours each year in large health systems. And here’s the frustrating part: manual workflows rarely reuse prior assessments well, so teams end up collecting and reviewing much of the same evidence again every year.
Labor cost is only one side of the CFO problem. Slow workflows also push remediation out, which adds more risk.
Where manual work increases financial exposure
Slow workflows stretch exposure windows. When teams track risk findings in spreadsheets and manage them through email threads, time-to-remediation tends to drag. High-risk issues can stay open for 60 to 180 days. Financially, that delay matters. Breach incidents with a lifecycle longer than 200 days cost more than $1 million extra per event compared with those contained faster.[2]
Third-party risk is where this hits hardest in healthcare. In 2023, 58% of the 77.3 million individuals affected by healthcare data breaches were compromised through attacks on healthcare third-party providers.[5] If vendor reviews are infrequent, incomplete, or based on old responses, an organization may not spot a shift in a business associate's security posture until after something goes wrong. The same problem shows up with connected devices and cloud tools that never go through a formal security review.
Weak exception visibility makes things worse. When accepted risks, compensating controls, and overdue findings live across disconnected documents and email threads, management may not have a clean view of how many open issues exist or how long they’ve been sitting there. That partial picture increases the odds of adverse compliance findings: the average HIPAA fine reached $1.2 million in 2023, up from $800,000 in 2021.[3]
Suggested baseline comparison table: manual vs. AI-enabled risk work
These figures set the manual baseline for the ROI model.
| Metric | Manual Baseline | AI-Enabled Target |
|---|---|---|
| Assessment cycle time | 30–90 days | Shorter |
| Labor hours per assessment | 20–60 hours | Lower |
| Audit preparation hours | 200–800 hours per major audit | Lower |
| Time-to-remediation (high-risk findings) | 60–180 days | Shorter |
| Open exception rate | 15–30% of controls or vendors | Lower |
| Annualized loss expectancy (ALE) | $3M–$5M+ per year | Lower |
Those gaps become the ROI inputs in the next section.
sbb-itb-535baee
How Censinet GRC AI Changes RiskOps Costs
Faster third-party and enterprise assessments with AI help
Compared with the manual process above, Censinet GRC AI cuts the time risk teams spend on third-party reviews by automating questionnaires, evidence review, summary drafting, and routing. Inside Censinet RiskOps™, Censinet AI™ uses healthcare-specific templates mapped to NIST CSF 2.0, HICP, and HHS HPH CPGs to pre-fill known responses and surface targeted follow-up questions. It also summarizes SOC 2 reports, penetration tests, BAAs, and policies, so analysts can focus on gaps instead of rereading every document.
That changes the work in a simple way: risk teams review and approve AI-drafted summaries instead of starting from scratch. The Censinet Risk Assessor Agent delivers up to 66% less time on key third-party workflows by automating manual review and prioritizing exposure [1]. Humans still keep final approval authority.
For a large U.S. health system running 300 third-party assessments per year, dropping average labor from 10–12 hours to 4–6 hours per assessment saves about 1,800 hours each year. At a blended rate of $100 per hour, that comes to roughly $180,000 in direct annual labor savings, a key factor in the economic impact of third-party risk management. And that’s before you factor in faster time-to-contract or less need for outside consulting help.
The math gets even better when the same vendors return for annual review.
Delta-based reassessment, benchmarking, and dashboards
Censinet RiskOps uses delta-based reassessment to carry forward unchanged responses and focus only on what changed: new services, updated certifications, new integrations, or incidents. Instead of redoing the whole review, teams can zero in on the parts that matter. That can cut reassessment effort by 40–70% compared with full reassessments.
On a portfolio of 500 active vendors, that means about 1,000–3,000 hours saved per year, or roughly $100,000–$300,000 in annual labor savings. It also lets teams review higher-risk vendors more often without matching jumps in cost.
Benchmarking adds another layer. Censinet's aggregated, anonymized data across healthcare organizations lets CFOs compare open exception rates, remediation timelines, and control coverage against sector peers. If a health system lands in the bottom quartile for remediation speed, that’s a plain signal: money or staff time may be better spent there than elsewhere.
Dashboards help turn that signal into action. They show open risks by severity, owners, due dates, and control coverage, including NIST AI RMF. Finance leaders can filter by vendor criticality or business unit, then tie shifts in exception rates and mean time-to-remediation to changes in estimated breach probability. In practice, that gives them a way to connect control gaps to dollar-based risk exposure.
Suggested capability-to-value table: AI features and cost drivers
| Censinet Capability | CFO Metric | Mechanism |
|---|---|---|
| Questionnaire automation | Hours per assessment | Pre-fills known responses and generates targeted follow-up questions |
| Evidence summarization | Hours per assessment; consultant spend | Summarizes evidence and flags gaps |
| Delta-based reassessment | Recurring reassessment labor | Carries forward unchanged responses |
| Command center dashboards | Days to remediation; estimated loss exposure | Shows open risks, owners, due dates, and severity |
| Governance routing | Open exceptions; days to approval | Routes findings to approvers |
| Benchmarking | Budget targeting; board reporting | Compares performance with peers |
Those savings feed into the ROI model in the next section.
Healthcare AI Governance - Risks, Compliance, and Frameworks Explained | Medix Coffee Chat
A CFO Model for ROI, Payback, and Loss Avoidance
GRC AI ROI: $477,500 Annual Benefit for Healthcare Organizations
Core formulas finance teams can use
Three formulas do most of the work in a GRC AI business case.
ROI = (Benefits − Costs) / Costs. Benefits can include labor savings, lower consulting spend, faster remediation, and avoided breach losses. Costs usually cover subscription, implementation, training, change management, and administration.
Payback Period = Initial Investment / Annual Net Benefit. Initial investment includes software subscription, implementation, change management, and training. Annual net benefit is total quantified benefits minus annual GRC.AI costs.
ALE = SLE × ARO. SLE is loss per event. ARO is event frequency. Better controls can push down one or both.
A healthcare example with conservative assumptions
Illustrative only; based on conservative industry benchmarks.
You can use the formulas above to turn labor savings and loss avoidance into a case the board can review quickly. In this example, the value comes from four places: assessment labor, audit preparation, control testing, and loss avoidance.
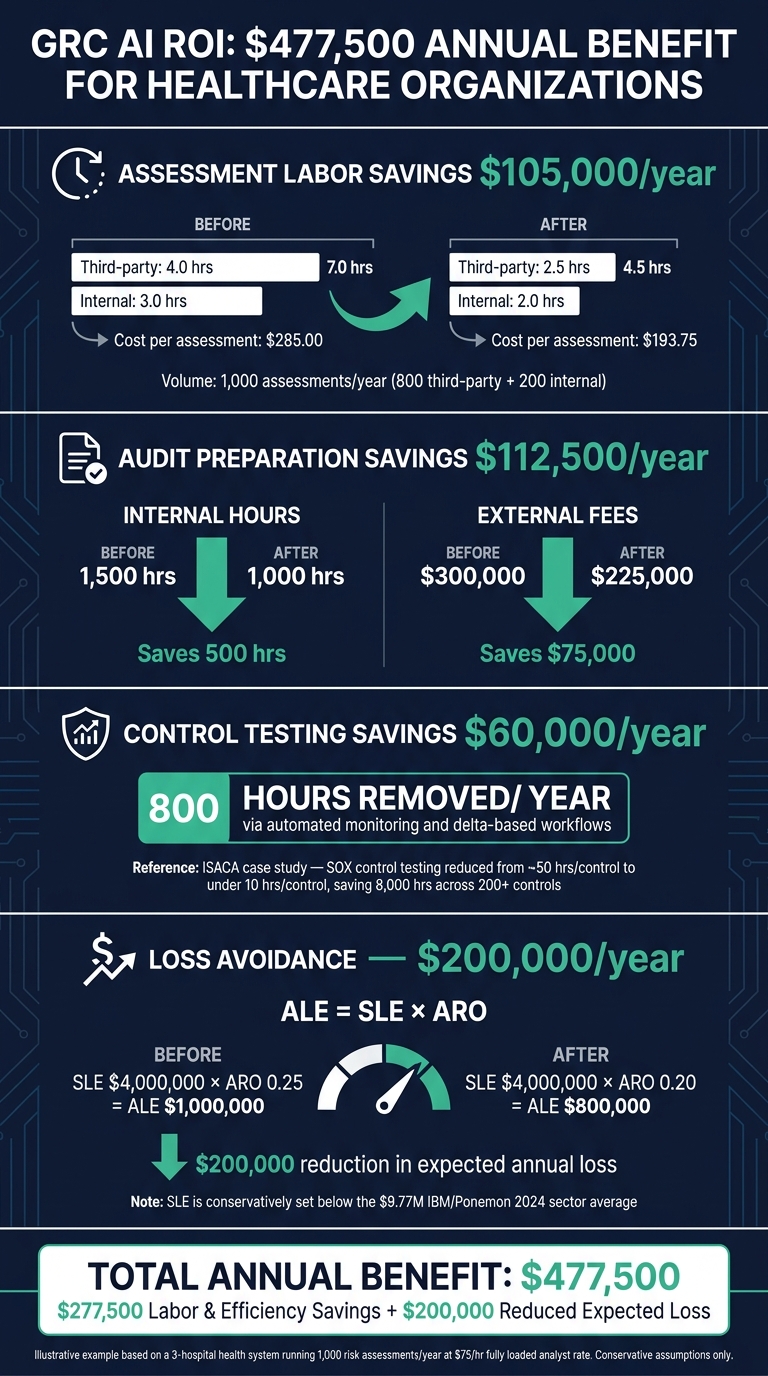
Start with a three-hospital health system that runs 1,000 risk assessments per year - 800 third-party and 200 internal - using a fully loaded analyst rate of $75 per hour. Before GRC AI, third-party assessments take 4.0 hours each, and internal assessments take 3.0 hours each. That puts the average cost per assessment at $285.00. Audit preparation uses 1,500 internal staff hours each year, plus $300,000 in external audit and consulting fees. Control testing adds another 2,000 hours per year.
On the loss side, the baseline ALE is $1,000,000 per year. That comes from an SLE of $4,000,000 per major PHI breach and an ARO of 0.25, or one major incident every four years. That $4,000,000 SLE is well below the $9.77 million average cited in IBM/Ponemon 2024 reporting [7][8][9][10].
After deploying Censinet RiskOps, powered by Censinet AI, the math changes in a few clear ways:
- Assessment labor: Third-party review time drops from 4.0 hours to 2.5 hours. Internal review time drops from 3.0 hours to 2.0 hours. The new cost per assessment falls to about $193.75, which saves about $105,000 per year in direct labor.
- Audit preparation: Internal hours drop from 1,500 to 1,000, and external fees fall from $300,000 to $225,000. That adds up to $112,500 per year in savings.
- Control testing: Automated monitoring and delta-based workflows remove 800 hours from the annual testing load, saving $60,000 per year. For context, ISACA documented a health insurance company that reduced SOX control testing from roughly 50 hours per control per year to under 10 hours after automation, saving about 8,000 hours across more than 200 controls [6].
- Loss avoidance: Better vendor screening and faster remediation reduce the ARO from 0.25 to 0.20. The new ALE is $4,000,000 × 0.20 = $800,000, which means a $200,000 annual reduction in expected loss.
Total quantified annual benefit: $477,500 ($277,500 in labor and efficiency savings + $200,000 in reduced expected loss).
Those assumptions feed into the 3-year scorecard below. From there, the CFO can compare annual net benefit against the initial investment and annual costs to work out payback and 3-year value.
Suggested ROI scorecard table for a 3-year business case
The table below shows the fields CFOs should fill in with actual data from RiskOps dashboards, audit logs, finance systems, and the risk register.
| Metric | Baseline (Year 0) | Year 1 | Year 2 | Year 3 |
|---|---|---|---|---|
| Annual GRC labor cost | Calculate from HR/labor data | Recalculate annually | Recalculate annually | Recalculate annually |
| Assessments completed | 1,000 | Track actual volume | Track actual volume | Track actual volume |
| Cost per assessment | $285.00 | Recalculate from labor hours | Recalculate from labor hours | Recalculate from labor hours |
| Audit preparation hours | 1,500 hrs | Track actual hours | Track actual hours | Track actual hours |
| Time-to-remediation (median, high-risk) | Baseline from risk logs | Track actual days | Track actual days | Track actual days |
| ALE | $1,000,000 | Recalculate annually | Recalculate annually | Recalculate annually |
| Annual net benefit | - | Total quantified benefits minus ongoing GRC.AI costs | Total quantified benefits minus ongoing GRC.AI costs | Total quantified benefits minus ongoing GRC.AI costs |
| Cumulative net benefit | - | Year 1 net benefit | Year 1 + Year 2 net benefit | Year 1 + Year 2 + Year 3 net benefit |
Data sources: RiskOps dashboards, audit logs, finance records, and the risk register.
Use the same metrics every quarter so leadership can see trend lines instead of a one-off estimate. Two modeling rules matter here.
Use internal time-and-motion data whenever possible. Actual hours logged by assessment type will usually hold up better than industry averages.
Keep ALE assumptions conservative. The $4,000,000 SLE used here is set below published sector averages, so the board sees a floor on loss avoidance value, not a ceiling.
What CFOs Should Track and Report to the Board
The metrics that show value over time
CFOs need to turn risk work into numbers the board can act on. The simplest way to do that is to take the scorecard inputs from the prior section and convert them into board-level finance metrics.
Track:
- Cost per assessment
- Review time
- Time to remediation
- Exception rate
- Audit hours
- Framework coverage
These numbers help show whether AI is cutting cost, moving work faster, and keeping control quality in place.
Just as important, show quarter-over-quarter trends instead of a single before-and-after snapshot. A one-time gain can look nice on a slide. A steady trend line is what helps support staffing and budget decisions. Organizations like Emory Healthcare have seen similar success in streamlining their programs. When those trends keep holding, finance can use them for staffing plans, budgeting, and contractor planning.
Put framework coverage and reassessment cycle time near the top of the board dashboard. Coverage shows whether the team is keeping up with required controls. Reassessment cycle time shows how fast risk decisions change when vendors or regulations shift. Those two metrics give the board a quick read on pace and control.
The board dashboard: risk reduction in dollars
For the board, keep it tight. A one-page dashboard should include labor savings, estimated loss avoided, residual exposure, and framework coverage, with comparisons for the current quarter, year-to-date, and the prior quarter.
In healthcare, add two more measures:
- The percentage of critical vendors reviewed on time
- The number of overdue high-risk exceptions
Those metrics connect straight to patient safety and operational continuity.
This same dashboard can also support cyber insurance renewals, audit committee updates, and capital requests.
Show cost savings and risk reduction together. Efficiency on its own can weaken the case if control slips. Control on its own can hide cost if no one sees the labor burden.
Conclusion: The CFO case for GRC AI
Manual risk work is expensive, slow, and hard to scale. Assessment volume keeps going up. Regulatory pressure keeps building. Third-party complexity keeps growing.
AI-enabled RiskOps changes the economics. Faster assessments and delta-based reassessments cut hours per task and lower expected loss by improving coverage and remediation speed.
CFOs who bring clear formulas, conservative assumptions, and board-ready dashboards give leadership decision-ready evidence for investment.
FAQs
How do I build a credible ROI model for GRC AI?
Use a full year of internal data to set your baseline. That gives you a cleaner starting point and helps account for seasonal swings that can skew the numbers.
Calculate ROI with this formula: (Risk-Averted Costs + Efficiency Gains – Program Costs) ÷ Program Costs × 100.
Your ROI model should include three core inputs:
- Risk-averted costs
- Efficiency gains
- Program costs
Keep the forecast grounded. Build conservative estimates for both the 1–2 year window and the 3–5 year window so leaders can compare near-term impact with longer-range results.
Then surface those numbers in executive dashboards. Alongside ROI, show metrics like assessment completion time and risk reduction trends so stakeholders can see not just the dollar impact, but how performance is shifting over time.
Which metrics matter most to a CFO?
CFOs should zero in on metrics that tie GRC work to financial outcomes: ROI, payback period, annual cost savings, and risk-averted costs like avoided breach-related fines, remediation spend, legal fees, and downtime.
It also helps to track the day-to-day numbers that show where money and time are going. That includes cost-per-assessment, manual labor hours, time-to-remediation, vendor onboarding and audit timelines, exception rates, vendor SLA compliance, and security incident frequency and severity.
How should we conservatively estimate breach loss reduction?
Estimate it across the full range of breach-related costs: direct remediation, HIPAA fines, legal fees, class-action exposure, and operational disruption.
For a defensible ROI, use at least one full year of internal incident or claims data. Then calculate the average cost per incident and multiply that figure by the number of incidents you expect to prevent.
Related Blog Posts
- AI-Powered GRC: How Leading Organizations Are Automating Compliance in the Age of Increasing Regulation
- 6.2X ROI in Under 3 Months: The Healthcare GRC Investment That Pays for Itself
- The CFO's Guide to Healthcare GRC: Turning Compliance from Cost Center to Strategic Asset
- Why 92% of Healthcare Organizations Are Failing at GRC Integration - And How AI Changes Everything
