
If I want to know whether an IoT incident response plan works, I track five numbers: MTTD, MTTA/MTTR-Start, containment time, recovery time, and post-incident fix rate. Those five metrics show how fast I find a problem, how fast I act, how long it takes to stop it, how long it takes to get devices back into safe use, and whether I fix the root issue after the event.
IoT changes the math. A laptop can often be cut off with little risk. A connected pump, scanner, controller, or access system may need a slower, safer response. This often requires specialized medical device risk visibility to manage effectively. That is why I do not look at speed alone. I look at speed plus safe service use, vendor delays, device type, and weak telemetry.
Here’s the short version:
- MTTD shows how long it takes to spot and confirm an incident
- MTTA/MTTR-Start shows how long it takes to acknowledge an alert and take the first step
- Containment and Mitigation Time shows how long it takes to stop spread and put safeguards in place
- Recovery Time and Service Restoration shows how long it takes to return devices to checked, safe use
- Post-Incident Improvement Rate shows whether lessons from the incident turn into closed fixes
A few facts make this hard to ignore:
- Mandiant reported a 10-day global median dwell time in 2023
- Teams without 24/7 monitoring averaged 24 days
- Manufacturing was above 45 days
- One healthcare study found a median technology downtime of 5.1 hours
- Healthcare IoT breaches averaged $6.8 million in 2023
IoT Device Risk Management using NIST
sbb-itb-535baee
Quick Comparison
| Metric | What I learn from it | Main IoT issue it helps expose |
|---|---|---|
| MTTD | How long it takes to detect trouble | Sparse logs and weak visibility |
| MTTA / MTTR-Start | How fast the team reacts | Slow triage and handoffs |
| Containment Time | How fast the threat is stopped | Safety limits on device isolation |
| Recovery Time | How long until safe service is back | Testing, firmware checks, vendor delay |
| Improvement Rate | Whether fixes get closed after the incident | Repeat gaps and slow vendor follow-up |
If I am mapping incident response to NIST CSF 2.0, these five metrics give me a simple scorecard for Detect, Respond, and Recover in IoT settings.
Why IoT Metrics Differ From Standard IT Metrics
IoT incident metrics need to track safe operations, not speed alone. That’s the big shift.
With connected devices, you’re often dealing with clinical equipment, industrial controllers, or building systems. In those cases, a rushed containment step can do more damage than the incident itself. So response performance can’t be judged by raw speed alone. That is why the next metrics must measure more than raw response speed.
Device Diversity and Uneven Security Controls
IoT fleets can include cameras, sensors, controllers, gateways, and medical devices. Each device type may come with different firmware, protocols, and security controls. Some still lack even basic protections, which means a single metric like time to patch doesn’t tell the whole story.
A better approach is to group metrics by device class, firmware, and remediation path. That helps teams see:
- which assets can be handled in groups by firmware version
- which need vendor support
- which can be rolled back safely
That kind of split matters because the work involved can vary a lot from one device group to another.
Limited Visibility and Incomplete Telemetry
Many IoT devices produce sparse logs and offer little or no agent-based monitoring. NIST makes this point directly:
IoT devices may not log operational or security events in sufficient detail to support effective detection and investigation.[4]
When telemetry is weak, metrics like MTTD and containment time can paint an incomplete picture. They may look short on paper while hiding the extra manual work needed to detect, confirm, and investigate what actually happened.
Safety, Uptime, and Service Continuity Constraints
Isolating a laptop is usually low risk. Isolating an infusion pump or industrial controller is a different story.
For IoT, fast containment only helps if it keeps critical services running safely. That’s why teams should track whether containment preserved core function, how much downtime it caused, and whether a safe fallback mode was available.
Firmware and Vendor Dependency Risks
IoT remediation often depends on the manufacturer, which adds delay outside the incident response team’s control. Because of that, it makes sense to track vendor response time, time to remediation guidance, and the share of affected devices covered by a supported fix.
Vendor lag has a direct effect on recovery time and service restoration.
These constraints set the baseline for the five metrics that follow.
1. Mean Time to Detect (MTTD)
MTTD measures the average time between when an incident starts and when the team confirms it. The math is simple: add up total detection time across incidents, then divide by the number of incidents in the period.
In IoT, that starting point often isn't a clean log entry. It could be an odd dosage pattern from an infusion pump or an unexpected configuration change in a sensor network. That's what makes this metric so useful. You're not just timing alert review. You're timing how long it takes to spot trouble when the data is patchy.
Because IoT telemetry is often incomplete, detection speed depends on how fast teams can confirm anomalies from partial data. This metric lines up with the Detect (DE) function in NIST CSF 2.0, which focuses on timely discovery and analysis of anomalies and indicators of compromise[7][8]. For IoT, DE.AE and DE.CM matter most here. NIST CSF implementation guides also list MTTD as a key performance indicator for the Detect function[9].
The gap between good monitoring and weak monitoring can be huge. Mandiant's M-Trends 2024 reports a global median dwell time of 10 days in 2023, but organizations without 24/7 monitoring averaged 24 days and manufacturing exceeded 45 days.[6] In a connected care setting, delays like that just don't work.
A single fleet-wide target also misses the point. An infusion pump and an office sensor do not carry the same risk, so MTTD targets should match device criticality.
| Device Category | Example Devices | Realistic MTTD Target |
|---|---|---|
| High-criticality clinical | Infusion pumps, ventilators, imaging systems | Minutes to a few hours |
| Facility/life-safety systems | ICU HVAC, fire detection, access control | Hours |
| Lower-risk IoT endpoints | Administrative sensors, other non-critical IoT endpoints | Within 24 hours |
When telemetry is sparse, estimate incident onset time and report MTTD by device tier. That gives teams a more honest read on performance. It also makes trend lines more useful over time, since changes in one part of the fleet won't hide problems in another.
Once detection is measured, the next test is how fast the team acknowledges the issue and starts moving.
2. Mean Time to Acknowledge and Respond (MTTA/MTTR-Start)
MTTA measures the average time from an alert to formal acknowledgment and the first response action. You calculate it by averaging the time from alert to acknowledgment across incidents. Some teams also track MTTR-Start: the time from alert to the first documented containment step, such as isolating a device or opening a triage ticket. That helps you measure speed to first containment, separate from full remediation. It’s the earliest signal of response performance.
This matters in IoT because remediation often takes longer than the first response. MTTR-Start separates response speed from that slower remediation work. MTTA shows how fast Detect turns into Respond.
MTTA/MTTR-Start sits between the Detect (DE) and Respond (RS) functions in NIST CSF 2.0. Alert generation and monitoring tie to DE.CM and DE.DP. Acknowledgment and triage map to RS.RP, RS.CO, and RS.AN. Asset inventory also plays a big part here. If the team can identify the device and owner right away, they can stay focused on connected clinical devices instead of drifting into general IT operations. In a hospital, that time gap can hit more than one device.
A practical starting point in healthcare is 5–10 minutes for clinical devices during staffed hours and 15–30 minutes after hours. Non-critical IoT endpoints, such as environmental sensors and smart lighting, can handle longer windows. Track the median and p90, not just the mean, because outliers can skew the average.
| Device Type | Staffed Hours MTTA Target | After-Hours MTTA Target |
|---|---|---|
| Clinical (infusion pumps, imaging) | 5–10 minutes | 15–30 minutes |
| Facility/life-safety (HVAC, access control) | 15–30 minutes, risk-based | 15–30 minutes, risk-based |
| Non-critical IoT (sensors, smart lighting) | Longer, risk-based | Longer, risk-based |
Once acknowledgment is measured, the next step is simple: how fast can the team contain the device?
3. Containment and Mitigation Time
Containment and Mitigation Time tracks the gap between incident confirmation and the point where the threat is contained and interim safeguards are in place. It should be tracked by severity tier. Put simply, this is the first hard proof of whether your response process works.
This metric maps to NIST CSF 2.0 Respond, especially RS.MI-1 and RS.MI-2, and it relies on accurate inventory, segmentation, and telemetry.[1][10][11]
In IoT settings, containment isn't just about stopping spread. It also has to keep services safe to use. A networked infusion pump or imaging system, for example, may need selective isolation and temporary safeguards instead of a full disconnect. That tradeoff can add time, which means containment targets need to reflect those operating limits.
A few tactics can help cut this metric down:
- Pre-engineered VLAN segmentation
- Device-specific response playbooks
- SOAR-driven automated quarantine
When containment steps are already mapped out for high-risk device groups like anesthesia machines or building access controls, teams spend less time making decisions on the fly and more time carrying out a clear response plan.
| Severity Tier | Containment Target (Automated Segmentation) | Containment Target (Manual Response) |
|---|---|---|
| Critical IoT (clinical or life-safety) | 4–8 hours | Up to 24 hours |
| Routine/Low (sensors, non-critical endpoints) | 3–7 days | 3–7 days, risk-adjusted |
Once the threat is contained, the next metric is how fast services return to safe operation.
4. Recovery Time and Service Restoration
After containment, the next thing that matters is recovery: how fast IoT services get back to safe, checked, normal operation. Recovery Time and Service Restoration measures the time from formal containment to verified, safe return to normal operation.
In IoT, and especially in healthcare, recovery is not done just because a device powers back on. It ends only after firmware integrity checks, functional testing, and safety validation confirm the device is ready for use. In NIST CSF 2.0, this maps most closely to the Recover (RC) function, especially RC.RP (Recovery Planning) and RC.IM (Improvements). Those areas cover recovery plan execution, backup checks, system restoration, and confirmation that normal operating status has returned.[1][13]
A JAMA Network Open study on patient care technology disruptions found a median downtime of 5.1 hours. Most services, 58.1%, recovered within 6 hours, but 7.8% had outages that lasted more than 48 hours.[12]
Recovery targets should match device criticality and patient safety impact:
| Device Category | Target Recovery Time | Key Constraint |
|---|---|---|
| Life-critical devices (infusion pumps, ventilators) | 4–24 hours (localized); ≤72 hours (class-wide) | Safety validation and vendor patch availability |
| Clinical support systems (patient monitoring, imaging networks) | 24–72 hours | Functional testing and workflow handoff |
| Building management IoT (HVAC, access control) | 24–96 hours | Redundancy and safety impact |
| Industrial/lab IoT (automation controllers, sensors) | 48–120 hours | Physical process integrity |
Want to shrink this metric? Preparation does most of the heavy lifting. Pre-tested firmware backups, automated provisioning, and device-specific recovery playbooks cut down the time teams spend deciding what to do in the middle of an incident.
Vendor response plays a big part too. If a patch needs vendor help and there is no defined SLA for emergency support, recovery can slow to a crawl. Censinet RiskOps™ can connect recovery performance to vendor commitments and medical device classes, which helps teams spot where delays are built into the process and where focused spending can help most.
5. Post-Incident Improvement Rate
Post-Incident Improvement Rate shows how fast incident lessons turn into verified fixes across devices, processes, and controls. You can track the share of corrective actions closed within 30, 60, or 90 days, along with the share of incidents that lead to implemented control changes.
Once recovery is done, the next step is simple: did the incident make the program better, or did the team just move on? In NIST CSF 2.0, this metric supports Respond and Recover. It also connects lessons learned back into all six functions through the Improvement category.[3][2]
IoT makes this harder and more urgent. A fix may depend on a vendor, device limits, or both. Devices often stay in use for years, patches can move slowly, and vendor dependence can let the same problem come back again.
That risk is not abstract. For medical devices, the FDA recorded at least 18 cybersecurity-related alerts from 2013 to 2025, covering infusion pumps, pacemakers, cardiac devices, and patient monitoring systems.[14]
A practical way to track this metric is to benchmark closure by severity with 30-, 60-, or 90-day SLAs. High-risk findings tied to patient-facing, safety-critical, or internet-exposed devices may call for 80% to 90% closure within 30 days.[15] It also helps to watch for repeat incidents and check whether the next event is found, contained, or stopped faster. Then review results again at 90 to 180 days to confirm risk reduction.[16]
Treat every major incident as a required control change, then verify that the fix is in place and working. Put this metric on the same scorecard as detection, response, containment, and recovery. That way, improvement is tied to future performance, not just good intentions. For healthcare organizations, Censinet RiskOps™ can help track third-party and device-risk remediation workflows.
Side-by-Side Comparison of the 5 Metrics
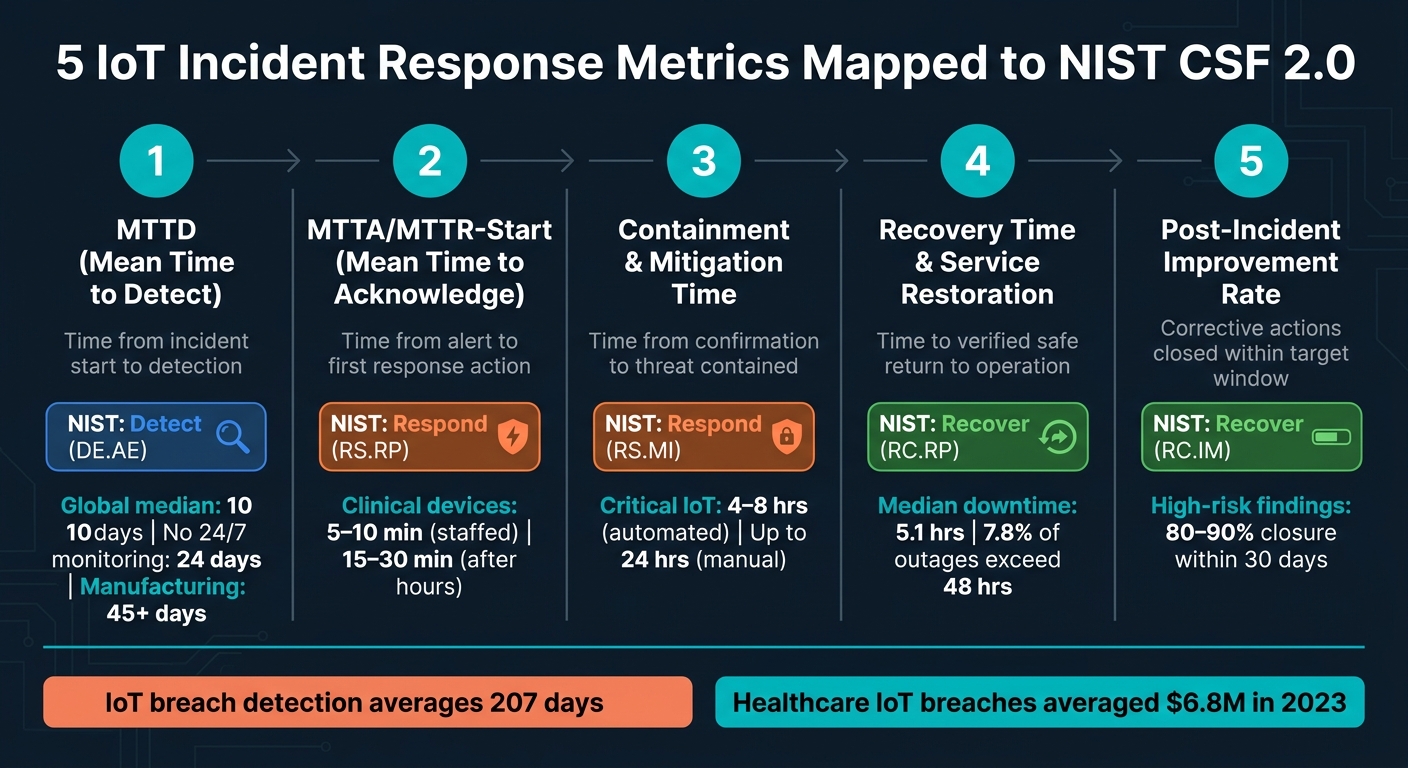
5 IoT Incident Response Metrics Mapped to NIST CSF 2.0
Use this scorecard to compare the five IoT incident-response metrics at a glance. NIST treats detection, response, and recovery metrics as core performance measures for the Cybersecurity Framework.
Read the scorecard from left to right: detect, acknowledge, contain, recover, improve.
| Metric | What It Measures | Primary NIST CSF Function | Why It Matters for IoT |
|---|---|---|---|
| Mean Time to Detect (MTTD) | Time from incident start to first identification | Detect (DE.AE) | Sparse telemetry can delay detection |
| Mean Time to Acknowledge and Respond (MTTA/MTTR-Start) | Time from alert to acknowledgment and first action | Respond (RS.RP) | Cross-team handoffs can slow action |
| Containment and Mitigation Time | Time from response start to containment | Respond (RS.MI) | Always-on devices can spread impact |
| Recovery Time and Service Restoration | Time to restore safe device and workflow operation | Recover (RC.RP) | Downtime affects safety and business continuity |
| Post-Incident Improvement Rate | Percent of corrective actions closed in the target window | Recover (RC.IM) | Vendor gaps can slow closure |
Conclusion
Track the few metrics that show whether Detect, Respond, and Recover are working for connected devices. Each one points to a different place where things can break down. Taken together, they show device visibility, response time, containment, restoration, and whether your team is learning and getting better over time.
This matters because the cost of slow detection is steep. IoT breach detection averages 207 days, and healthcare IoT breaches averaged $6.8 million in 2023.[5]
For healthcare teams, delays like that make benchmarked remediation workflows a must. For healthcare organizations, Censinet RiskOps™ can tie these metrics to device inventories, vendor risk, and remediation workflows.
The goal is steady progress across all five metrics.
FAQs
How do I set IoT metric targets by device risk?
Start by sorting each device’s risk with an inventory and severity matrix. Base that rating on clinical impact, data importance, and regulatory risk.
From there, set targets for the controls most closely tied to patient risk. Then track those targets over time in a consistent way. Focus on measures like risk assessment completion and review timing, patching cadence, credential hygiene, encryption or secure boot coverage, and detection and response speed.
Which NIST CSF 2.0 functions do these metrics support?
These IoT incident-response metrics map to Detect, Respond, and Recover in NIST CSF 2.0.
- Detect: time to detect, acknowledge, and triage, plus detection coverage
- Respond: time to contain and respond, containment success, evidence preservation, triage accuracy, and communication quality
- Recover: service restoration, recovery objectives, recovery duration, and post-incident review/actions
They support Govern in a more limited way, mainly when teams track reporting and leadership review.
What should I track when vendors delay IoT remediation?
Track metrics that show risk exposure and progress against safety timelines, such as:
- Median time to patch by severity tier
- Devices past vendor end-of-support without documented compensating controls
- Percentage patched within policy timelines
- Volume of overdue corrective actions
Censinet RiskOps™ can centralize vendor metrics like notification times, remediation progress, and SLA adherence.
