Healthcare organizations face growing cybersecurity threats, stricter regulations, and rising costs. Third-party risk management (TPRM) is critical, but proving its financial value to executives can be challenging. Here's the bottom line:
- Executives need measurable ROI: They want numbers showing cost savings, risk reduction, and compliance efficiency - not vague promises.
- Key metrics to track ROI: Focus on automation-driven cost savings, incident prevention, and compliance improvements.
- How to calculate ROI: Use simple formulas to measure savings from automation, reduced breaches, and compliance efficiency versus program costs.
- Case studies prove results: Tools like Censinet RiskOps™ have reduced staffing needs by 60% for vendor assessments and improved risk visibility.
Key Metrics for Calculating TPRM ROI
To measure the return on investment (ROI) for your Third-Party Risk Management (TPRM) program, focus on three main areas: cost savings through automation, risk reduction, and compliance efficiency. Each of these categories offers clear metrics to evaluate your program's effectiveness while demonstrating its value in both operational efficiency and risk management.
In healthcare, where value-based care ties quality metrics to reimbursement, precise ROI tracking becomes even more critical. As Cured.health aptly puts it, a single smart investment can save 100 lives, highlighting the ethical and financial importance of mastering ROI in this sector [3].
Automation-Driven Cost Savings
Automation significantly reduces the time spent on manual tasks like vendor assessments, paperwork, and follow-ups, translating into measurable cost savings. For instance, if your team dedicates 20 hours a week to manual vendor assessments at an average hourly rate of $45, that totals $46,800 annually. Cutting this time in half through automation would save $23,400 per year. This is particularly important in healthcare, where rapid responses and detailed documentation are non-negotiable.
Beyond labor costs, automation streamlines operations across the board. Metrics such as fewer claim denials, faster payment cycles, and lower administrative overhead demonstrate these improvements [3]. These efficiencies not only reduce the cost of care but also free up staff to focus on patient care [4]. Additionally, consider the indirect costs of workflow disruptions and the opportunity costs of diverting staff from higher-value tasks - automation helps mitigate these hidden expenses [3].
Risk Reduction and Incident Prevention
An effective TPRM program minimizes the chances of data breaches and reduces the financial fallout when incidents do occur. Clinically, this translates into fewer medical errors, fewer adverse events, and lower costs associated with extended hospital stays or malpractice claims [3]. Each avoided data breach can save your organization from steep regulatory fines, remediation costs, and the long-term reputational damage that often accompanies such incidents.
To measure impact, track the frequency and severity of incidents before and after implementing your TPRM program. Calculate the average cost per incident - factoring in investigation expenses, equipment replacement, lost productivity, and regulatory fines - and multiply this by the number of incidents prevented [5]. A single avoided HIPAA breach can save hundreds of thousands of dollars in fines alone, not to mention downstream costs like patient notifications, credit monitoring, and legal fees [5]. Preventing such incidents also safeguards the trust your patients place in your organization, a critical asset in healthcare.
Compliance and Regulatory Efficiency Gains
Streamlined compliance processes save time and resources while helping avoid costly penalties. In healthcare, investments must meet strict regulatory standards, which adds complexity to ROI calculations compared to other industries [3]. Key metrics include time saved on compliance activities, adherence to regulatory requirements, and increased reimbursement from quality bonuses in value-based care programs [3].
For example, if your team spends 30 hours per month on vendor documentation at $50 per hour, that's $18,000 annually. Reducing this workload by 40% would save $7,200 per year. Additionally, avoiding penalties through improved compliance processes can lead to significant cost avoidance, even if these efforts require higher upfront investments [1]. These savings, combined with regulatory stability, enhance your organization's financial and operational health.
How to Build a TPRM ROI Calculator
How to Calculate Third-Party Risk Management ROI in Healthcare
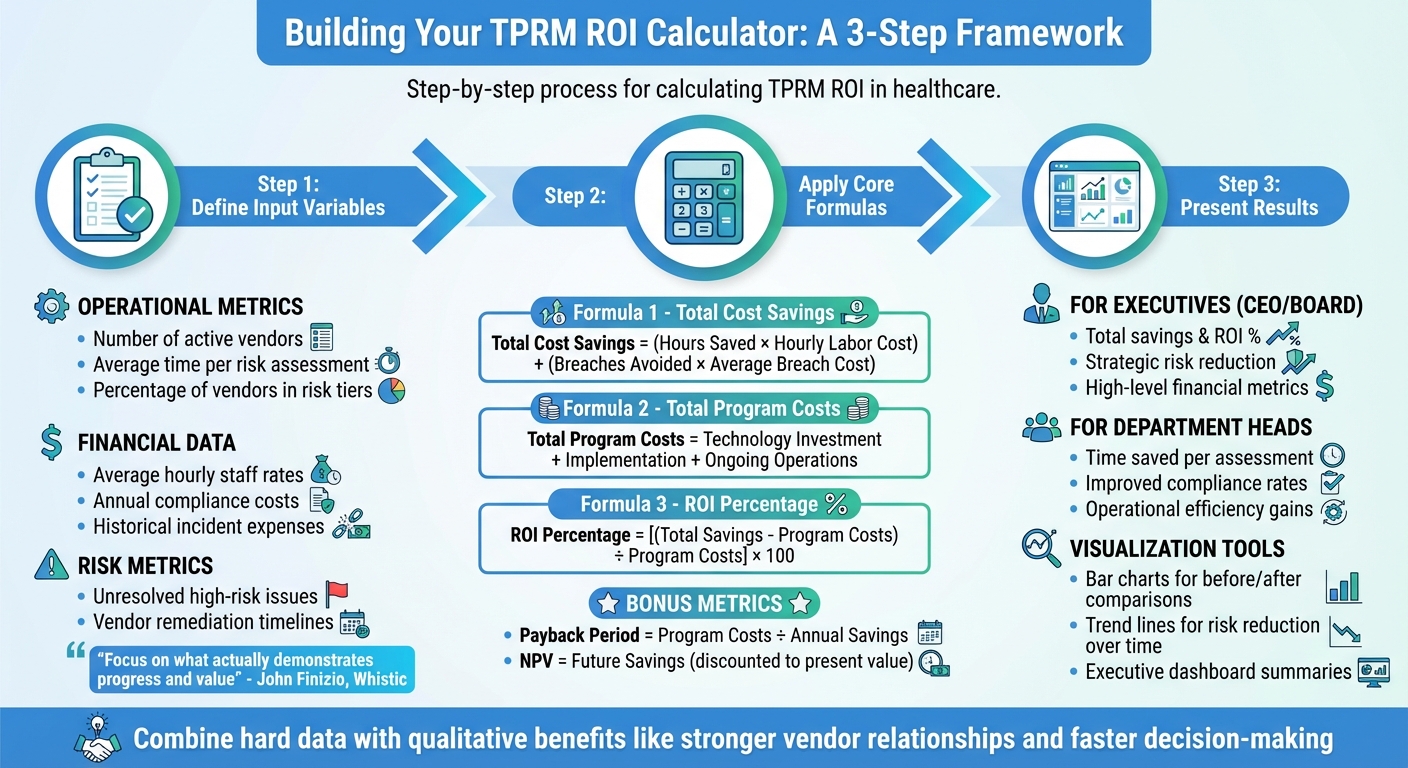
Creating a TPRM ROI calculator involves defining key input variables, structuring accurate calculations, and presenting results in a way that resonates with decision-makers. The goal is to focus on data that highlights measurable progress and demonstrates clear value.
Defining Input Variables for ROI Calculation
Start by identifying data that reflects your current TPRM operations and costs. Key input variables should include operational metrics such as the number of active vendors, the average time spent on each risk assessment, and the percentage of vendors in different risk tiers. You'll also need financial data, including average hourly rates for staff conducting assessments, annual costs of manual compliance activities, and historical expenses from security incidents or regulatory penalties.
Additionally, incorporate risk-related metrics like unresolved high-risk issues and vendor remediation timelines. This baseline data can be gathered from vendor management systems, compliance records, and incident response logs. As John Finizio, VP of Security, Risk, and Compliance at Whistic, advises:
"It's easy to get caught up trying to measure everything, but not every metric is relevant; focus on what actually demonstrates progress and value for your organization" [6].
Once you've identified these inputs, the next step is to apply precise formulas to quantify their impact.
Formulas and Calculation Steps
Your ROI calculation should revolve around three core formulas.
- Total Cost Savings: Multiply the hours saved through automation by the average hourly labor cost, then add the costs avoided from prevented incidents (number of breaches avoided × average breach cost).
- Total Program Costs: Add up technology investments, implementation expenses, and ongoing operational costs.
- ROI: Use the formula (Total Cost Savings – Total Program Costs) ÷ Total Program Costs × 100 to calculate the return on investment.
To further enhance your analysis, calculate the payback period by dividing total program costs by annual savings to determine how long it will take for the investment to break even. If you're evaluating long-term benefits, compute the Net Present Value (NPV) by discounting future savings to their present value using your organization's standard discount rate. Be sure to include efficiency gains from automation, AI-driven analysis, and external risk data in these calculations.
Presenting Outputs for Maximum Impact
Transform your calculations into an engaging visual narrative that highlights both financial and operational impacts. Use a dashboard to display key metrics like ROI, payback period, and annual savings. Incorporate bar charts to show before-and-after comparisons, such as assessment completion times or vendor remediation rates, and add a trend line to illustrate risk reduction over time.
Tailor your presentation to your audience. For executives like the CEO or board members, focus on high-level financial metrics such as total savings, ROI percentage, and strategic risk reduction. Department heads, on the other hand, will appreciate operational details like time saved per assessment and improved compliance rates. As NavexGlobal points out, the most effective ROI presentations combine hard data with qualitative benefits, like stronger vendor relationships and faster decision-making [7]. By providing clear, concise data reports, you'll help stakeholders see the direct value of your TPRM program and make informed, data-driven decisions [2].
ROI Examples from Censinet RiskOps™
Healthcare organizations have shared real-world examples of how Censinet RiskOps™ has delivered measurable benefits. By improving automation, boosting efficiency, and enhancing risk visibility, the platform has shown clear financial and operational value - key for justifying third-party risk management (TPRM) investments.
Case Study: Cutting Assessment Time
Tower Health saw a dramatic improvement in efficiency after implementing Censinet RiskOps™ for its vendor risk assessments. Before adopting the platform, the organization needed 5 full-time employees (FTEs) dedicated exclusively to these assessments. Post-implementation, that number dropped to just 2 FTEs - a 60% reduction in staffing requirements.
This shift allowed skilled professionals to focus on other critical security tasks. Terry Grogan, CISO at Tower Health, shared:
"Censinet RiskOps allowed 3 FTEs to go back to their real jobs! Now we do a lot more risk assessments with only 2 FTEs required" [8].
Not only did this change free up resources, but it also increased the volume of assessments completed. By comparing staffing needs and assessment counts before and after adopting the platform, Tower Health demonstrated how these efficiency gains led to broader improvements in risk visibility.
Case Study: Decreasing Risk Exposure
Baptist Health used Censinet RiskOps™ to overhaul its vendor management and improve risk tracking. By moving away from manual spreadsheet systems, the organization closed gaps in risk identification and sped up remediation efforts.
James Case, VP & CISO at Baptist Health, emphasized the impact of joining the platform's collaborative network:
"Not only did we get rid of spreadsheets, but we have that larger community [of hospitals] to partner and work with" [8].
With access to Censinet's expansive network - covering more than 50,000 vendors and products - Baptist Health could identify high-risk vendors faster and address issues more efficiently. The platform's standardized frameworks, based on NIST CSF, ISO, and HIPAA guidelines, further streamlined compliance and risk management processes.
Faith Regional Health also benefited from Censinet's benchmarking tools. Brian Sterud, CIO at Faith Regional Health, explained:
"Benchmarking against industry standards helps us advocate for the right resources and ensures we are leading where it matters" [8].
This benchmarking capability enabled organizations to compare their performance against industry standards, helping them allocate resources more effectively.
Comparison Table: Metrics Before and After Censinet
The measurable improvements from these case studies are summarized in the table below:
| Metric | Before Censinet | After Censinet | Improvement |
|---|---|---|---|
| FTEs Required for Assessments | 5 FTEs | 2 FTEs | 60% reduction |
| Assessment Completion Method | Manual spreadsheets | Automated workflows | Streamlined processes |
| Vendor Network Access | Limited to direct relationships | 50,000+ vendors and products | Broader intelligence |
| Risk Visibility | Delayed, fragmented | Real-time dashboards | Immediate insights |
| Compliance Framework Integration | Manual mapping | Automated NIST, ISO, HIPAA alignment | Faster compliance validation |
| Peer Benchmarking | Not available | Industry-standard comparisons | Data-driven resource advocacy |
These results highlight how Censinet RiskOps™ transforms TPRM from a manual, resource-intensive process into a streamlined, automated system. The platform not only saves costs but also enhances risk management capabilities, offering healthcare organizations a smarter way to protect their operations.
sbb-itb-535baee
Customizing ROI Calculators for Healthcare Executives
Healthcare executives face the challenge of balancing financial goals, patient safety, and operational efficiency all at once. A one-size-fits-all ROI calculator simply doesn't cut it. To gain their support for your TPRM program, you need to show them customized results that directly align with their priorities and clearly demonstrate measurable outcomes.
Aligning Outputs with Executive Priorities
Healthcare leaders focus on metrics that impact both financial performance and patient care outcomes. An effective ROI calculator should highlight cost savings from automation and operational improvements while also showcasing benefits like better patient satisfaction, reduced staff burnout, and improved retention rates. By using organization-specific data - like the number of vendor assessments, hours spent on manual reviews, costs of incidents, and compliance expenses - you can create projections that truly reflect your organization's unique needs.
Scenario analysis is another powerful tool. It allows executives to compare different strategies, such as automating 50% versus 80% of assessments, to see how various approaches can affect risk exposure and operational efficiency. Using clear, straightforward language - like "lower cost per vendor evaluation" or "enhanced resilience through faster risk identification" - helps communicate these benefits effectively. For instance, healthcare organizations that have adopted automation solutions have reported a 75% drop in staff attrition, leading to significant savings in recruitment and training costs [10].
Adding industry benchmarks into the mix provides valuable context, enabling executives to compare their organization's performance with peers. This helps set realistic targets for improvement and supports resource allocation decisions. Combining these benchmarks with the demonstrated advantages of automation and risk reduction strengthens the case for investment.
But customizing outputs is only part of the equation - how you present these results is just as critical for securing buy-in.
Visualization and Reporting Tips
Numbers alone can overwhelm or mislead. To make your case compelling, you need to present your customized outputs in a way that resonates with executives. Executive dashboards are a great tool for highlighting key insights.
Start your ROI reports with an executive summary that outlines the investment, expected gains, and overall impact. This concise overview allows busy executives to grasp the value quickly before diving into detailed financial and operational analyses [13].
Use conservative projections to build trust [12]. For example, if your data suggests a 60% reduction in assessment time, consider presenting a more cautious figure of 50% to account for potential implementation challenges. Provide both short-term (12–24 months) and long-term (3–5 years) ROI estimates, as TPRM investments often yield increasing returns over time through enhanced automation and improved risk visibility [13].
Tailor your reports to showcase cost savings, efficiency gains, and overall impact [9] [11]. Including real-world examples from similar organizations - such as how they reduced assessment times or improved operational efficiency - can help illustrate the tangible benefits executives can expect to achieve.
Conclusion
Demonstrating the value of your TPRM program is crucial for gaining resources and executive backing. Healthcare leaders prioritize decisions that showcase clear financial benefits and operational improvements. When you can prove that your TPRM investments lower costs, prevent incidents, and streamline efficiency, you elevate risk management from a simple compliance task to a strategic advantage. This approach helps align technical risk management efforts with the priorities of executive decision-makers.
To tailor your case, create an ROI calculator that addresses your organization’s specific needs. Keith Walter from Pfizer highlighted the importance of this approach when discussing their TPRM evolution:
"we have found a clear efficiency to increase our number of assessments capab per FTE by a very considerable amount and in the end that's a return on investment and that's really where we've you know really measured ourselves against to make sure that we are making the right investments and looking at the right vendors" [14].
By moving from manual spreadsheets to automated workflows, Pfizer doubled their FTE productivity[14], proving that the right tools can deliver measurable outcomes.
Case studies further confirm that efficiency gains validate your TPRM efforts. Censinet RiskOps™ supports this by scaling your program with automated workflows and AI-driven assessments, ensuring both speed and accuracy. Tools like Censinet AITM accelerate vendor questionnaire completion and evidence validation, cutting down assessment times while enhancing risk detection.
When presenting your ROI findings, use conservative estimates, clear visuals, and projections that highlight both immediate and long-term savings. Show executives not only the cost savings today but also how automation and improved risk visibility will continue to deliver value over time. Emphasize reduced costs, minimized risks, and improved compliance, along with benefits like higher staff retention.
Ultimately, connecting TPRM investments to tangible results is key to securing executive support. A well-designed ROI calculator doesn’t just justify spending - it illustrates how effective risk management safeguards patients, strengthens operations, and positions your organization for long-term success.
FAQs
How can I show the value of Third-Party Risk Management (TPRM) to healthcare executives?
To help healthcare executives understand the importance of TPRM, it's essential to focus on the measurable outcomes it delivers. Show how it minimizes risks, builds stronger vendor relationships, ensures compliance with regulations, and helps avoid expensive disruptions. Highlight benefits like cost savings, streamlined operations, and better patient safety.
By sharing specific data - such as fewer incidents, quicker vendor evaluations, and higher compliance rates - you can make a strong case for the return on investment (ROI) and emphasize how TPRM safeguards both the organization’s reputation and financial health.
What metrics should I focus on to measure the ROI of third-party risk management in healthcare?
To gauge the return on investment (ROI) of third-party risk management (TPRM) in healthcare, it's essential to track specific metrics that highlight its impact. Here are some key areas to focus on:
- Cost savings: Look for reductions in expenses through streamlined workflows and eliminating inefficiencies.
- Risk reduction: Measure how well vulnerabilities and potential breaches are minimized.
- Breach response expenses: Quantify savings from preventing costly incidents before they occur.
- Vendor assessment frequency: Use this to evaluate the efficiency of your vendor review processes.
- Operational downtime: Track improvements in system uptime and availability.
- Compliance costs: Assess savings from avoiding fines or penalties tied to regulatory requirements.
By monitoring these metrics, you can clearly showcase the value your TPRM program brings to healthcare executives, ensuring it aligns with the broader goals of the organization.
How does automation help reduce costs in third-party risk management?
Automation dramatically cuts costs in third-party risk management by streamlining complicated tasks and reducing reliance on manual labor. Tasks like data collection, analysis, and continuous monitoring can be automated, leading to improved efficiency and fewer errors. This saves time and ensures potential risks are less likely to slip through the cracks.
On top of that, automation speeds up decision-making and optimizes resource allocation, allowing your team to concentrate on more critical responsibilities. The outcome? A smoother, more cost-efficient way to handle third-party risks.
Related Blog Posts
- Common Healthcare Third-Party Risk Assessment Questions
- Third-Party Risk Management ROI Calculator: Prove Your Program's Value to Healthcare Executives
- Healthcare Third-Party Risk Management Maturity Model: Where Does Your Organization Stand?
- The Business Case for Healthcare TPRM: Cost Savings and Risk Reduction Statistics
